Understanding Solar PV Energy Flow: From Sunlight to Useful Electricity
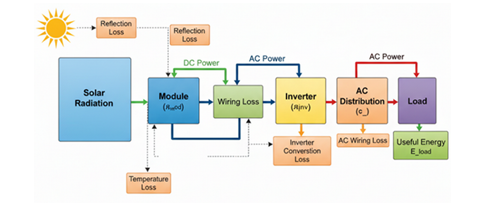
Solar photovoltaic (PV) systems are often described as simple: sunlight hits a panel and electricity is produced. In reality, the journey from solar radiation to usable electrical energy involves multiple stages, each with its own efficiency limits and energy losses. The attached diagram provides a clear, system-level view of how energy flows through a typical grid-connected solar PV system, highlighting where power is converted, where losses occur, and how useful energy is ultimately delivered to electrical loads.
Understanding this energy flow is essential for system designers, facility managers, sustainability professionals, and building owners who want to maximize system performance, improve return on investment, and ensure accurate energy modeling for certifications such as LEED, TRUE, or net-zero energy reporting.
This article walks through each stage shown in the diagram and explains the technical significance of the losses and conversions involved.
1. Solar Radiation: The Primary Energy Source
The process begins with solar radiation, which represents the sunlight incident on the surface of the PV modules. The amount of solar energy available depends on several environmental and site-specific factors:
- Geographic location and latitude
- Time of day and season
- Atmospheric conditions (cloud cover, dust, pollution)
- Panel orientation (tilt and azimuth)
- Shading from nearby buildings, trees, or structures
Even before sunlight reaches the solar cells, some energy is already reduced due to atmospheric absorption and scattering. However, the diagram focuses on what happens once solar radiation reaches the module surface.
2. Reflection Loss: Not All Sunlight Is Absorbed
One of the first losses shown in the diagram is reflection loss. When sunlight strikes the glass surface of a solar panel, a portion of it is reflected back into the atmosphere instead of being absorbed by the solar cells.
Key contributors to reflection loss include:
- Glass surface properties
- Angle of incidence of sunlight
- Dust, dirt, and soiling on the module surface
- Anti-reflective coating effectiveness
Modern PV modules use anti-reflective coatings to minimize this loss, but it cannot be eliminated entirely. Typically, reflection losses can range from 2% to 5% or more, depending on conditions.
3. PV Module: Converting Light to DC Power
The PV module is where solar radiation is converted into electrical energy through the photovoltaic effect. When photons strike the semiconductor material (usually silicon), they excite electrons, creating a flow of direct current (DC) electricity.
However, the module is also subject to several internal losses:
a) Temperature Loss
The diagram highlights temperature loss, which is one of the most significant performance factors in real-world PV systems. As module temperature increases, voltage decreases, reducing overall power output.
High ambient temperatures, poor ventilation, or rooftop heat buildup can all increase cell temperature. This is why module performance is rated at Standard Test Conditions (STC), which are rarely achieved in actual field conditions.
Typical temperature-related impacts:
- For crystalline silicon modules, power output can decrease by about 0.3% to 0.5% per °C increase above 25°C.
- In hot climates, temperature losses can be substantial over the year.
b) Module Conversion Efficiency
Even under ideal conditions, PV modules only convert a portion of incoming solar energy into electricity. Commercial modules typically have efficiencies in the range of:
- 18% to 23% for modern crystalline silicon modules
The remaining energy is lost as heat or reflected light.
4. DC Power and Wiring Losses
After electricity is generated in the module, it flows as DC power through DC cabling toward the inverter. The diagram clearly shows wiring loss at this stage.
DC wiring losses occur due to:
- Electrical resistance in cables
- Cable length and cross-sectional area
- Connector quality and terminations
- Temperature of conductors
These losses are proportional to current and resistance (I²R losses). Proper system design minimizes DC wiring losses by:
- Using appropriately sized conductors
- Minimizing cable lengths
- Ensuring high-quality connections
- Maintaining good installation practices
While individual wiring losses may seem small, across large systems they can represent a measurable reduction in delivered energy.
5. Inverter: DC to AC Conversion
The inverter is one of the most critical components in a grid-connected PV system. Its primary role is to convert DC power from the modules into AC power, which is compatible with building loads and the utility grid.
The diagram highlights inverter conversion loss, which represents the inefficiency of this DC-to-AC conversion process.
Typical inverter efficiencies:
- Modern string and central inverters: 97% to 99% peak efficiency
- Actual operating efficiency varies with load, voltage, and temperature
Inverter losses include:
- Power electronics switching losses
- Internal control and cooling power consumption
- Conversion inefficiencies at partial load
In addition to energy conversion, inverters also provide critical functions such as:
- Maximum Power Point Tracking (MPPT)
- Grid synchronization
- Voltage and frequency regulation
- Anti-islanding protection
6. AC Distribution and AC Wiring Losses
Once converted to AC, electricity flows through the building’s AC distribution system to reach end-use loads. The diagram shows AC wiring losses at this stage.
AC wiring losses are similar in nature to DC wiring losses and depend on:
- Cable length
- Conductor size
- Load current
- Connection quality
In large commercial or campus-scale installations, AC distribution losses can be non-trivial, especially if the inverter is located far from major load centers or main distribution panels.
Good electrical design practices aim to:
- Optimize inverter placement
- Size conductors appropriately
- Minimize unnecessary voltage drops
7. Load: Useful Energy Delivered
The final stage in the diagram is the load, representing the building equipment, systems, or grid that consume the electricity. This is labeled as useful energy (E_load) — the portion of the original solar radiation that is successfully converted into electricity and delivered for productive use.
Typical loads in commercial and institutional buildings include:
- HVAC systems
- Lighting
- IT and data center equipment
- Office equipment
- Process loads and machinery
From a performance and sustainability perspective, this is the energy that matters most. It is what offsets grid electricity, reduces carbon emissions, and contributes to financial savings.
Why These Losses Matter for System Performance
The diagram makes an important point: solar PV system performance is not defined by module efficiency alone. Total system performance is determined by the cumulative effect of all losses across the energy chain.
These include:
- Optical losses (reflection)
- Thermal losses (temperature)
- Electrical losses (DC and AC wiring)
- Power electronics losses (inverter)
In performance modeling, this is often captured in metrics such as:
- Performance Ratio (PR)
- System efficiency
- Net AC energy yield
For certifications, energy audits, and performance guarantees, understanding these loss mechanisms is critical for:
- Accurate energy simulations
- Realistic production estimates
- Diagnosing underperformance
- Optimizing O&M strategies
Practical Implications for Designers and Facility Managers
By referencing the energy flow shown in the diagram, stakeholders can identify practical ways to improve system output:
- Use high-efficiency, low-temperature-coefficient modules
- Ensure proper module ventilation
- Minimize shading and soiling
- Optimize DC and AC cable sizing and routing
- Select high-efficiency inverters
- Place inverters close to major load centers
- Implement regular inspection and maintenance
Each small improvement compounds across the system, increasing the percentage of solar radiation that ultimately becomes useful electrical energy.
Conclusion
The attached image provides a concise but powerful visualization of how solar energy moves through a PV system — from sunlight to useful electricity. It clearly illustrates that energy losses occur at multiple stages and that system performance is the result of the entire chain, not just the solar panels.
For professionals involved in renewable energy, building sustainability, and energy management, this systems-level understanding is essential. It enables better design decisions, more accurate performance expectations, and stronger operational strategies to maximize the value of solar investments.