Main Explanation (Dashboard Interpretation Narrative)
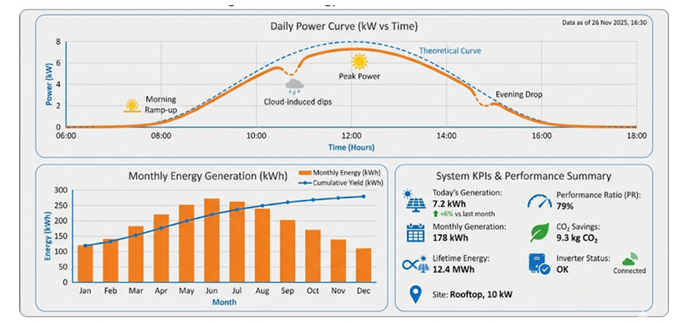
The illustrated dashboard presents a comprehensive performance view of a rooftop solar PV system, combining real-time power behavior, long-term energy trends, and key performance indicators (KPIs) into a single, decision-ready interface. Such dashboards are central to modern solar monitoring systems, enabling operators, asset owners, and O&M teams to quickly assess system health and performance.
1. Daily Power Curve (kW vs Time)
The upper chart displays the daily power generation profile from morning to evening.
- Morning Ramp-Up
Power output increases steadily after sunrise as solar irradiance rises and modules begin operating efficiently. - Theoretical vs Actual Curve
The dotted line represents the theoretical or expected power curve based on irradiance and system capacity, while the solid line reflects actual generation. Deviations between the two help identify losses. - Cloud-Induced Dips
Temporary reductions in output during mid-day indicate passing cloud cover or transient shading events. - Peak Power
Around solar noon, the system reaches its maximum output, confirming correct inverter operation and DC/AC sizing. - Evening Drop
Generation gradually declines as irradiance reduces toward sunset.
This curve is essential for diagnosing shading, inverter clipping, or abnormal generation patterns.
2. Monthly Energy Generation (kWh)
The lower-left chart presents monthly energy production trends across the year.
- Bar Graph – Monthly Energy (kWh)
Shows individual monthly generation, reflecting seasonal variations in irradiance and weather. - Line Graph – Cumulative Yield (kWh)
Tracks total energy produced over time, helping stakeholders verify annual yield targets.
Higher production during summer months and lower generation during monsoon or winter periods is typical and expected in most regions.
3. System KPIs and Performance Summary
The right-hand panel consolidates critical performance indicators:
- Today’s Generation
Instant confirmation of daily output. - Monthly Generation
Cumulative energy produced in the current month. - Lifetime Energy
Total energy generated since commissioning, a key metric for ROI analysis. - Performance Ratio (PR)
Indicates overall system efficiency after accounting for losses. A PR of ~79% reflects healthy system performance for rooftop installations. - CO₂ Savings
Quantifies environmental impact by converting energy generation into avoided carbon emissions. - Inverter Status
Confirms communication and operational status, ensuring data reliability. - System Details
Location, system type (rooftop), and installed capacity provide essential context.
4. Operational and Business Value
This dashboard enables:
- Rapid fault detection
- Performance benchmarking against expected values
- Transparent reporting for asset owners and investors
- Data-backed maintenance planning
By combining real-time power data with historical trends and KPIs, operators can move from reactive monitoring to proactive performance optimization.